There are many types of point cloud file formats used in different industries today. In this article, we explore the most common formats and explain how to process them effectively.
The rapid decline in the cost of LiDAR devices, together with their distinct advantages over cameras, has led to a surge in their adoption across various fields — from autonomous driving and construction to environmental mapping. However, compared to camera images, LiDAR point clouds can be more difficult to work with because they require specialized software and data handling methods.
Below, we take a closer look at the main point cloud file formats, and discuss how to open, visualize, and process them — either through code or free software tools.
What are Point Clouds?
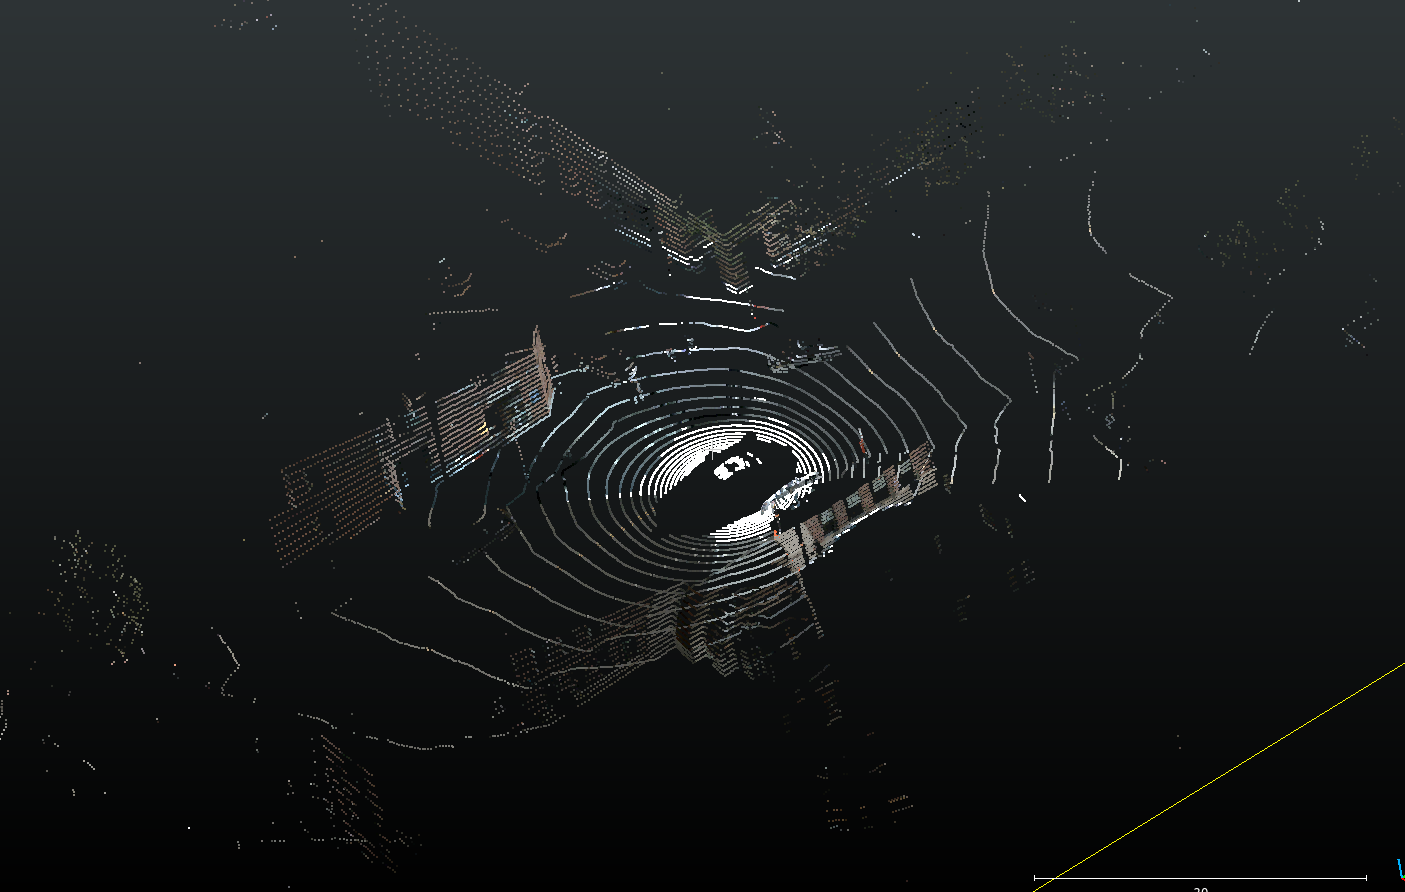
A point cloud from the Nuscenes dataset. The colors have been imposed on the point cloud from camera images.
A point cloud is essentially a large set of data points in three-dimensional (3D) space. Each point represents a specific location with X, Y, and Z coordinates that describe its position. Point clouds are most often generated by LiDAR sensors (Light Detection and Ranging), but can also be produced through Photogrammetry or RADAR-based scanning.
Imagine a room being scanned by a precise laser that measures the distance to every surface — the floor, walls, ceiling, and objects inside. Every single measurement is a point, and together they form a dense 3D representation of that space.
Besides coordinates, each point in a cloud can also include additional attributes:
- Intensity values: These indicate how strongly the LiDAR pulse is reflected. Bright, reflective surfaces like traffic signs have high intensity values, while darker materials like asphalt reflect less light.
- RGB values: In some cases, color data from cameras is combined with LiDAR data, assigning red, green, and blue values to each point to create a more realistic visual model.
The way these attributes are recorded and stored depends on the file format used. Below, we explore some of the most common formats and how to work with them.
Working with Point Clouds
We will use the Open3D and Laspy Python libraries to read and visualize different point cloud formats. For those who prefer not to code, open-source visualization tools like CloudCompare can be used to view PCD, PLY, and LAS files directly.
However, if you need to perform annotation or segmentation tasks — such as labeling point clouds, drawing cuboids, or working with fused sensor data (LiDAR + camera images) — tools like Coral Mountain’s LiDAR annotation platform are designed specifically for this purpose. The platform supports both intensity-based and RGB point clouds, and can handle large datasets efficiently.
BIN Format
The .bin format isn’t a standardized point cloud format, but rather a raw binary dump of LiDAR data. It doesn’t include metadata describing what the data represents, so you need to know the structure beforehand — for example, which attributes are stored (XYZ, intensity, etc.) and their data type.
Here’s how to read a .bin file containing 3D coordinates and intensity values stored as 4-byte floats using Python:
ảnh
The result can then be converted into an Open3D point cloud for visualization or processing.
PCD File Format
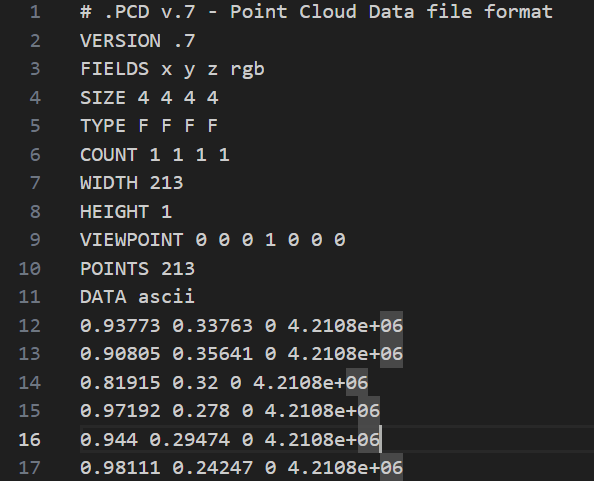
A sample PCD file in ASCII format. The header ends at line 11, after which the numerical points data follows.
The PCD (Point Cloud Data) format is one of the most commonly used file types in the industry. It supports both ASCII and binary storage modes.
- ASCII PCD files can be opened in a text editor and are easy to inspect manually, but they take up more space.
- Binary PCD files are much smaller and faster to load, though they can’t be read by humans directly.
Every PCD file has two sections:
- Header: Describes the structure of the data (e.g., which attributes are included).
- Body: Contains the actual numerical point data.
PCD files can be viewed directly using CloudCompare or processed through Python libraries like Open3D.
PLY Format
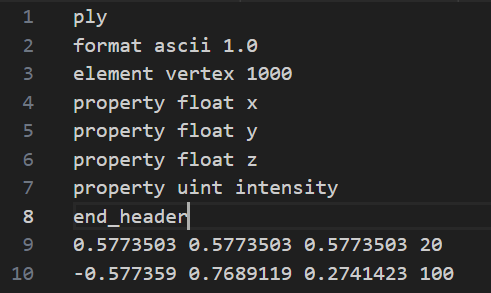
An example PLY file in ASCII format. The first 8 lines decribe the header. The lines after the header specify the points themselves.
The PLY (Polygon File Format) is another widely supported point cloud format that, like PCD, can be stored as either ASCII or Binary. It also includes a header followed by the main body of data.
The header (written in plain text) describes the structure of the file — such as how many points there are and what attributes each point contains. The body then lists those points, either as human-readable text (ASCII) or compact binary values.
Example of reading a .ply file with Open3D:
ảnh
Like PCD files, PLY files can also be opened directly in CloudCompare for easy visualization.
LAS Format
The LAS format (and its compressed version, LAZ) is widely used in aerial LiDAR mapping — for example, datasets collected from drones, airplanes, or satellites. LAS files can store millions or even billions of points, making them ideal for geospatial applications.
However, due to their large size, rendering LAS files may cause performance issues on computers without a strong GPU. To improve efficiency, users often divide large datasets into smaller tiles or use optimized libraries such as Laspy.
Here’s how to read coordinates from a .las or .laz file:
ảnh
The Laspy library is especially efficient for handling large point cloud files and provides detailed access to metadata such as GPS time, classification, and intensity.
Common Point Cloud File Extensions
- .bin – Raw binary data, typically from LiDAR sensors.
- .pcd – Point Cloud Data format (ASCII or binary).
- .ply – Polygon File Format (ASCII or binary).
- .las / .laz – Standard formats for aerial and geospatial point clouds, with .laz being the compressed version.
Conclusion
Point cloud data comes in a wide range of formats, each suited for specific workflows. ASCII formats are easy to read but can be large and slow to process, while binary formats are compact and efficient but require dedicated software to interpret.
Although viewing 3D point clouds may seem complex compared to standard images, understanding their formats — and using the right tools like Open3D, Laspy, CloudCompare, or Coral Mountain’s annotation platform — makes it possible to unlock the immense potential of LiDAR and 3D scanning data for research, automation, and industry applications.
Coral Mountain Data is a data annotation and data collection company that provides high-quality data annotation services for Artificial Intelligence (AI) and Machine Learning (ML) models, ensuring reliable input datasets. Our annotation solutions include LiDAR point cloud data, enhancing the performance of AI and ML models. Coral Mountain Data provide high-quality data about coral reefs including sounds of coral reefs, marine life, waves….