
A developer once showed me two API calls made to the same model using identical prompts. One response was insightful and creative, while the other was repetitive and barely useful. They were confused because, from their perspective, nothing had changed.
Then I asked about their sampling settings. That’s where the difference appeared: one call used k=50, the other k=5.
Top-k sampling sits at the center of a problem most teams overlook. It’s one of the most widely used decoding strategies in production, yet it’s often treated like a plug-and-play number copied from someone else’s config. In reality, every top-k value reflects an implicit definition of what “good output” means-and most teams never question that assumption.
What often goes unnoticed is that top-k doesn’t just influence output quality. It fundamentally shapes model behavior at inference time and even affects what your evaluation results actually measure.
What is top-k sampling?
At each step of generation, a language model assigns probabilities across its entire vocabulary-often tens of thousands of tokens. It doesn’t “know” the next word; instead, it distributes likelihood across many possible continuations.
Top-k sampling applies a strict filter to that uncertainty. It keeps only the k most probable tokens, removes the rest, then renormalizes the probabilities before sampling the next token.
How does top-k sampling work?
The mechanism itself is simple, but the implications are far more complex.
With k=10, the model can only choose from its top 10 predicted tokens. Token number 11-even if it’s nearly as likely-is completely excluded. With k=50, the model has far more flexibility.
This difference doesn’t just expand options-it defines whether the model can access less obvious but potentially better continuations, or stay confined to its most confident guesses.
The key issue is that probability distributions vary by prompt:
- Sometimes one token dominates with high confidence
- Other times, probability is spread across many plausible options
Top-k treats both situations the same way, applying a fixed cutoff regardless of whether it removes noise or meaningful signal.
And since generation involves hundreds of token decisions, each cutoff compounds. The boundary you set with k effectively becomes the boundary of what the model is allowed to express.
How top-k shapes output variance
Output variance across repeated runs is a strong signal of whether a configuration is stable enough for production.
- At k=1, output is deterministic (greedy decoding)
- At k=5, outputs remain highly consistent
- At k=50, variation increases significantly
In one real case, a summarization system using k=50 produced outputs whose length varied by up to 40% for identical inputs. Tone also shifted-from highly precise to unexpectedly casual.
The tradeoff here isn’t just diversity-it’s exposure to uncertainty.
- Lower k hides ambiguity by forcing confident choices
- Higher k reveals uncertainty but allows more unpredictable outcomes
Top-k vs. greedy decoding, beam search, and nucleus sampling
Each decoding method reflects a different balance between consistency and diversity. What matters most is not which method is “best,” but how each one fails.
Greedy decoding (k=1)
Always selects the highest-probability token. It ensures consistency but can repeatedly produce the same mistakes, especially in edge cases.
Beam search
Tracks multiple candidate sequences and selects the most likely. It improves quality but increases latency and often leads to overly safe, generic outputs.
Nucleus sampling (top-p)
Selects tokens based on cumulative probability rather than a fixed count. It adapts to uncertainty but introduces unpredictability in output behavior.
Top-k sits in between: it offers controlled randomness, but with rigid boundaries that don’t adapt to the shape of the distribution.
Choosing by failure mode, not “best” method
The real decision is not which method is optimal, but which failure mode your system can tolerate.
- Greedy decoding: consistent but blind to edge cases
- Top-k: balanced but sensitive to cutoff issues
- Nucleus sampling: flexible but unstable
- Beam search: high quality but slower and often generic
The cutoff problem: where top-k fails
A common issue emerges when the model’s confidence varies across inputs.
In one case, a customer service bot performed well most of the time but occasionally generated incoherent responses. The root cause was a fixed k=40 interacting with changing probability distributions.
- For common queries, top tokens contained most of the probability mass → stable results
- For edge cases, probability spread widely → important tokens fell outside top-k
Testing showed that in successful outputs, k=40 captured ~94% of probability mass. In failures, it captured only ~68%.
Same configuration, completely different outcomes.
The cliff-edge effect
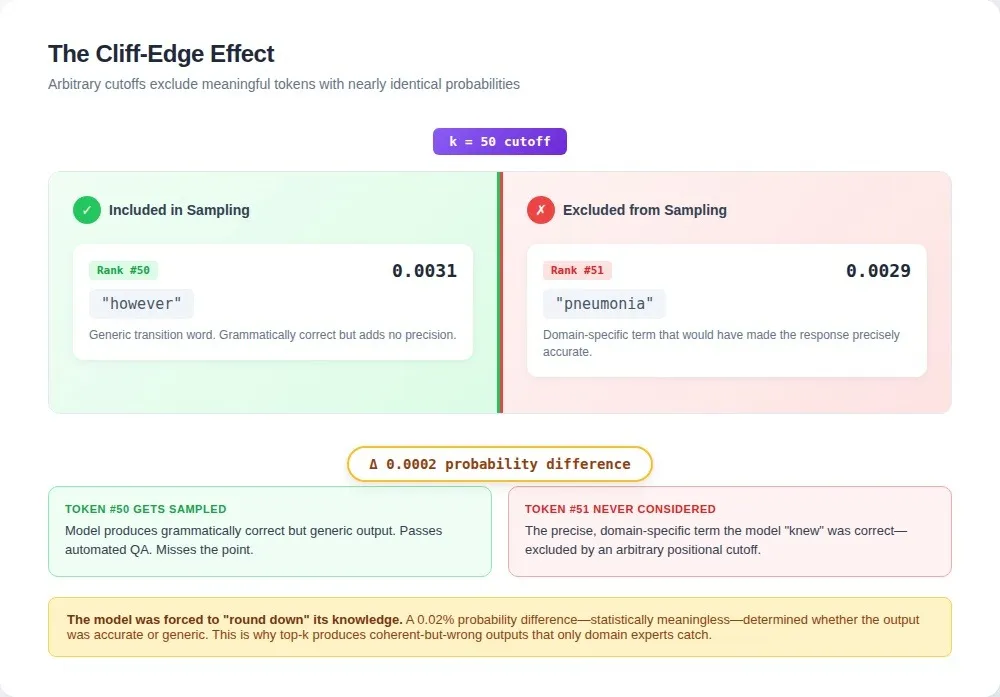
Small probability differences can lead to large consequences.
Imagine:
- Token #50 has probability 0.0031
- Token #51 has probability 0.0029
Nearly identical-but one is included, the other discarded.
If the excluded token carries critical domain meaning, the model is forced into a less accurate response simply due to an arbitrary cutoff.
Multimodal distributions fragment coherent choices
A more subtle issue appears when probability distributions contain multiple valid clusters.
For example, in a Python refactoring task:
- One cluster represented list comprehensions
- Another represented traditional for-loops
With k=20, the model could start a list comprehension but couldn’t complete it because later tokens were excluded. The result was code that looked unnatural-technically valid but inconsistent in structure.
Top-k assumes uncertainty has a clean boundary. In reality, distributions often reflect multiple valid solutions. A fixed cutoff can break that coherence.
Top-k values for extraction, generation, and multi-turn conversations
There’s no universal top-k setting. The right value depends on your use case.
Structured extraction (k=3 to k=10)
Allows slight flexibility without introducing randomness. Helps the model escape rigid patterns and handle edge cases.
Creative generation (k=40 to k=60)
Balances diversity and coherence. Higher values often reduce quality unless paired with proper temperature tuning.
Domain-specific tasks (k=10 to k=30)
Prioritizes accuracy while still allowing domain-specific language to surface when needed.
Multi-turn conversations
Top-k should adapt over time. Starting higher and gradually reducing k as context grows helps maintain coherence across long interactions.
Why your evaluation results don’t match production
Many apparent model performance issues are actually measurement problems.
Teams often compare results across different sampling configurations without realizing it. Even small changes in top-k can produce large shifts in output quality.
In one case, a team believed a new prompt performed worse than their baseline. The real issue:
- Testing used top-k=40
- Production used top-k=10
They weren’t comparing prompts-they were comparing entirely different systems.
Sampling parameters act as hidden variables. Without controlling them, evaluation results become unreliable.
Why synthetic evaluation fails
Synthetic data can reflect probability patterns, but not true quality.
Only human evaluation can determine whether an output is actually useful, accurate, or appropriate.
This is why parameter tuning alone cannot solve quality problems-judgment is still required.
Valid comparison requires parameter discipline
Reliable evaluation requires strict control over generation settings, including:
- Temperature
- Top-k or top-p
- Repetition penalties
- Random seeds
- Model versions
Without fixing these variables, comparisons become meaningless.
Contribute to AGI development at DataAnnotation
Adjusting top-k from 50 to 40 is easy. Determining whether that change actually improves output quality is much harder-and that’s where human judgment becomes essential.
This evaluation layer is what ultimately trains models to perform better. Parameters shape behavior, but human insight defines what “better” actually means.
If your background includes technical expertise, domain knowledge, or strong critical thinking, you can contribute to this process.
Getting started is simple:
- Visit the Coral Mountain application page and click “Apply”
- Fill out a short form with your background and availability
- Complete the Starter Assessment
- Check your inbox for the decision (usually within a few days)
- Log in, select a project, and begin working
There are no signup fees. The process is selective to maintain quality standards, and the Starter Assessment can only be taken once-so preparation matters.
Apply to DataAnnotation if you understand why quality matters more than volume in advancing frontier AI-and if you have the expertise to contribute.
Coral Mountain Data is a data annotation and data collection company that provides high-quality data annotation services for Artificial Intelligence (AI) and Machine Learning (ML) models, ensuring reliable input datasets. Our annotation solutions include LiDAR point cloud data, enhancing the performance of AI and ML models. Coral Mountain Data provide high-quality data about coral reefs including sounds of coral reefs, marine life, waves….